
Data is king. And consumers are subjected to it in vast and often overwhelming amounts every day.
Which begs the question: Why so much data?
Simple answer: Data works in helping consumers comprehend a complex story.
Are you trying to convince people to donate to a veterans’ services nonprofit? Then share the data about the number of veterans served or jobs filled. Or share the percentage of every dollar donated going directly to the needs of veterans vs. administrative costs.
Data can often present a compelling argument or illustrate a complex issue much more quickly and convincingly than a narrative alone. So critical is data to today’s storytelling that it has spawned an entire industry, if not an art form, called information design.
Simply put, information design is the practice of presenting information in a way that makes it most accessible and easily understood by users. Information design is targeted to specific audiences in specific situations to meet defined objectives.
One of the most common forms, in terms of telling a story, is the infographic – a blend of data, visual graphics and narrative that presents your story in a meaningful but easily digestible format.
A considerable bonus is the web-friendly nature of the infographic. They are generally easy to scroll through online and can be quite mobile-responsive when designed appropriately.
Following are a few examples of infographics that take a complicated data-driven topic and present it in a user-friendly format.
Education in the U.S.
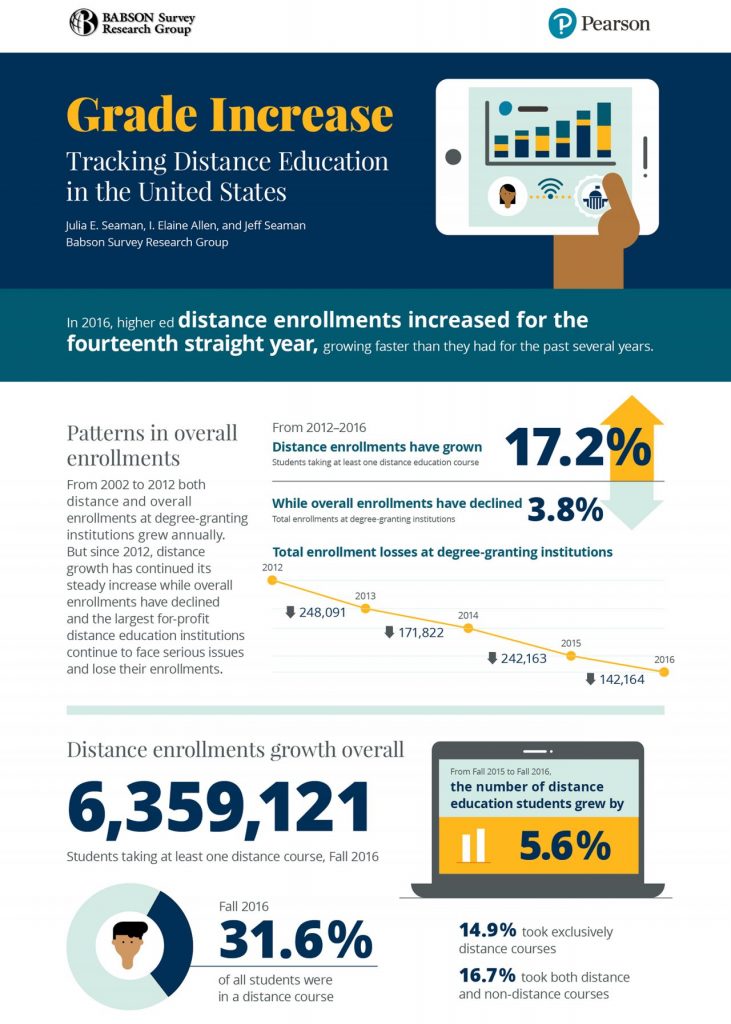
For the educational company Pearson, the challenge is to tell the story of rising trends in distance learning and the changes over time in the online education industry. As part of a campaign to establish their position in the industry, Pearson and the Babson Survey Research Group gathered data for their research report on higher education.
The organization used the infographic to show viewers a statistical timeline, highlighting percentages, years and other numbers that could have been difficult to follow in a text-only format.
Pearson’s infographic allows viewers to follow along as they scroll through with specific information called out in bigger font near colorful bars and arrows.
Charting the Impact of Disabilities
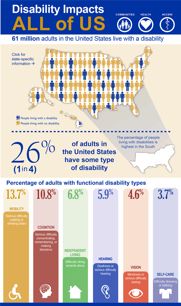
When it comes to telling the story of the impact of disease throughout the United States, the Centers for Disease Control and Prevention (CDC) stands apart.
In this example, the CDC joined forces with the National Center on Birth Defects and Developmental Disabilities, which informs the public about disability and its impact on communities, health, and access.
As part of their health education campaign to raise awareness about people living with a disability, the infographic uses hard data to advocate for collaboration towards improved health and living standards.
College Fast Facts
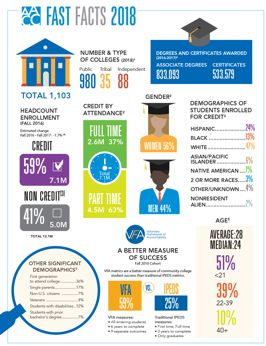
In its annual fast fact infographic, the American Association of Community Colleges informs the public, particularly individuals who want to go to college, about community colleges including headcount enrollment, student demographics, employment status, and financial aid information.
Presented as part of a college education report, the infographic summarizes significant data from a variety of sources, including the National Postsecondary Student Aid Study, the College Board, and the Bureau of Labor Statistics.
No matter the story, infographics can help cut through the clutter and provide a visual format that leads the consumer to whatever information you are trying to share.